DigitalRCS-TimeOverlay-Panel
A Grafana panel plugin for placing persistent, printable measurements and notes directly over time-series data.
Status
Submitted to the Grafana Plugin Catalog for Community review. It is not being represented as signed or catalog-approved at this time.
Overview
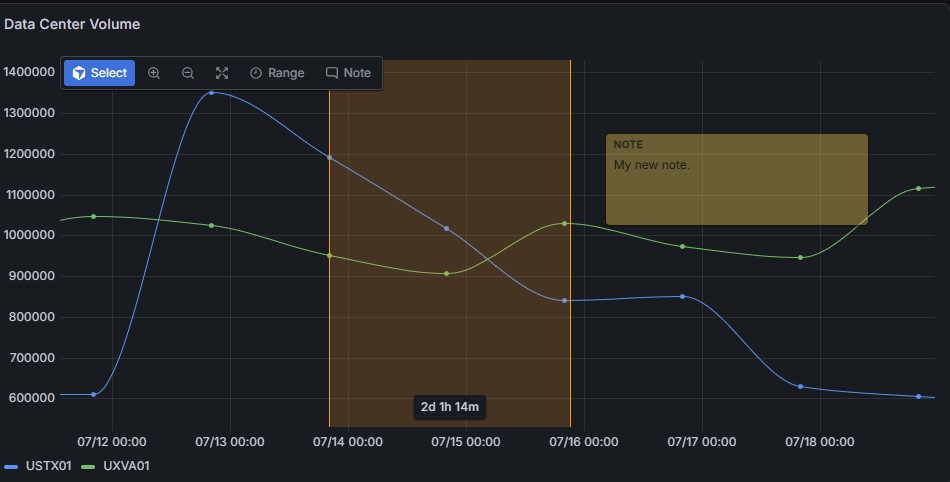
DigitalRCS-TimeOverlay-Panel installs as a separate Grafana visualization, so users can choose it from the visualization picker without replacing or modifying Grafana's built-in Time series panel.
The panel is built for teams that need measurement evidence to survive dashboard reloads and exported reports. Users can create duration ranges, add editable notes, inspect values, zoom into precise intervals, and save the overlay state with the dashboard.
What it does
Focused overlay tools for operational dashboards and exportable evidence.
Duration ranges
Create a highlighted time range by dragging across the plot, then move or resize it from either edge.
Movable notes
Add editable notes with translucent backgrounds, drag them by the header, and resize them from the corner.
Grafana-style navigation
Use drag-to-zoom, tooltips, axes, legends, 50 percent zoom steps, and a Zoom all reset.
Dynamic series
Render every numeric field returned by the query with names, units, labels, metadata, and overrides preserved.
Datasource independent
Consumes standard Grafana data frames from any compatible datasource instead of embedding query logic.
CSV and Splunk-friendly
Recognizes time/_time fields and converts common numeric strings or Splunk epoch timestamps when needed.
Printable evidence
Stores overlays in panel options so saved ranges and notes appear in Grafana PNG/PDF rendering paths.
Configurable display
Supports point markers, straight or smooth lines, palette colors, and independent range and note opacity.
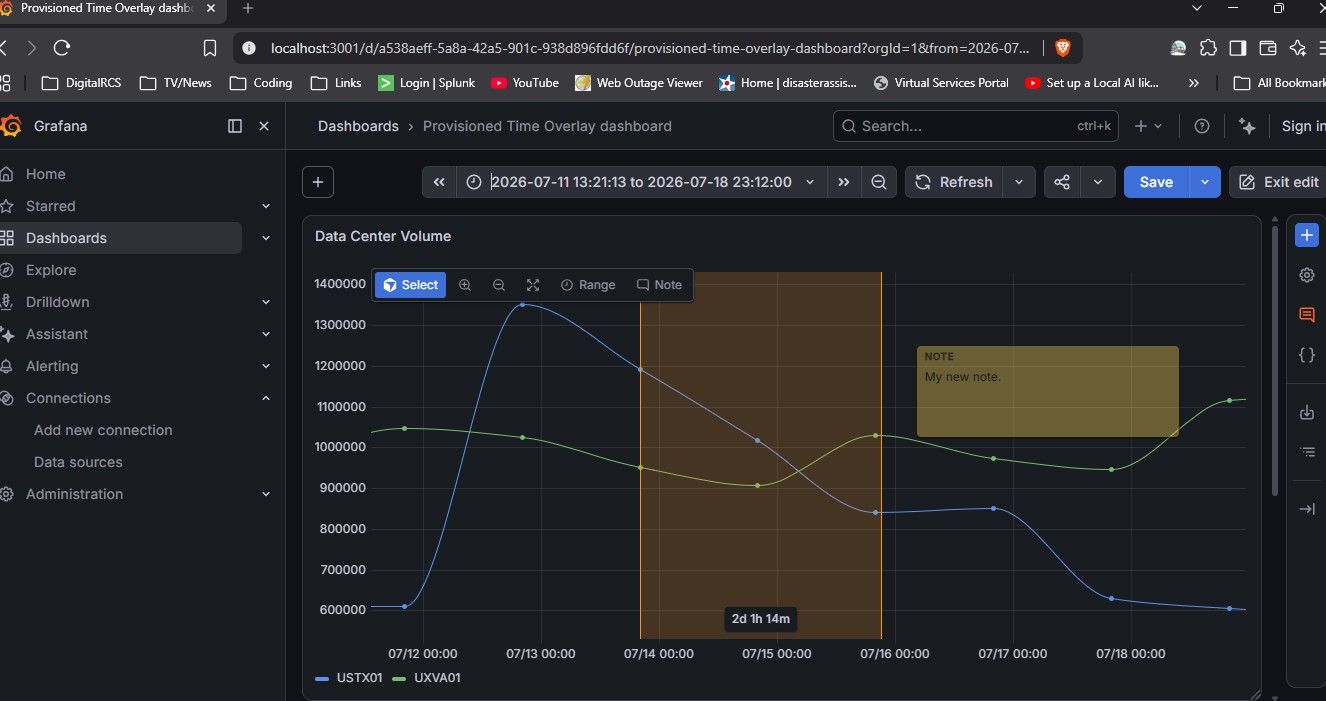
Screenshots
Local copies from the project repository, served from this website.
Documentation
The repository includes user, data-source, configuration, deployment, signing, developer, and troubleshooting documentation.